Are you ready? It is the age of the Internet of Things (IOT).
Data is everywhere, to be collected, stored, shaped and analysed. This is the capability to monitor and control business as never before. New and improving tools, products, techniques and algorithmics are providing a view into what happened, is happening and predictions of what will happen in our enterprises as never before.
No longer are we left to reporting and making decisions on yesterday’s news in our business processes. So to speak driving from our rear view mirror. We can determine not only what happened but root causes and why. We can make predictions on today’s trajectory for tomorrow’s optimization. Finally, prescribe solutions, actions, mitigations and remediations to chart a course to get more of what we want and less of what we do not want.
This is the Fourth Industrial Revolution. Change is at an exponential pace. There are some 14 billion devices connected to the internet. Predictions are that the industrial side of this or Industrial Internet of Things (IIOT) will be a Trillion $ market by 2028 with a 20%+ annual growth rate.
It promises to provide new solutions for manufacturers by drawing insights out of the data provided by physical assets for some of the oldest and toughest challenges.
Data driven decisions result in products 90% more likely to meet consumer needs.
A steam engine was never built just to move a locomotive around. It was an answer to a need to move goods, products, and people from one place to another. It was to enable better, faster and goal seeking business.
Electricity, electric generation, the alternating current power grid and electrification was not just to light Edison’s office with the new electric light bulb. It was for and about business enablement.
This is the Fourth Industrial Revolution. It is changing everything. Adapting, keeping pace and thriving in the new Industry 4.0 is “80% dependant on the expert management, engineering, business analysis and the shaping and analysis of data”. It is the business problem to solve.
Are you prepared to lead your business to thrive in this new industry and market?
Change is underway. Industry can choose to adopt and refine the tools, technologies, and processes on which it draws from those of Industry 4.0 or be subject to change that will arrive with or without an individual or business.
In 1991, Mark Weiser wrote in his Scientific American paper “The Computer for the 21st Century” that “the most profound technologies are those that disappear. They weave themselves into the fabric of everyday life until they become indistinguishable from it.” In fact, that as we in our modern lives, experience technology every day, it becomes ubiquitous and is taken for granted that it can always be relied upon. The impact is irrefutable. When it is not available, we are surprised, annoyed at the great exception that has stymied us.
This is the fate of industry. To evolve and adapt or be left behind. A steam plant or electric? Steam locomotive or diesel? A horse and carriage or an automobile? It is woven into the fabric of our world. The very way that we perceive our world and the way we solve day to day problems. Obvious only afterwards.
A couple generations ago it was different. There was no internet. No cell phones. When we ordered a pizza, it was a much different experience. One might have driven down to the local pizza shop, ordered, waited for it to be cooked and then returned home. Perhaps one dialled the pizza shop on the land line and waited for a delivery driver to arrive. If the pizza was prepared according to order, not too cold and delivered in a reasonable time we would give the driver cash for the pizza and a tip.
Today we go online to view the pizza shop’s website and menu. We select pizza, toppings and even when we desire for it to be delivered. We pay online including tip. The system is interactive showing when the pizza is picked up, how long it is estimated to delivery and then surveys us on the service for continuous improvement. Convenient for the pizza shop, the customer and enables an opportunity for delivery drivers and a new business for the service. We see this kind of innovation in Uber, Skip the Dishes, Door Dash and others. Life and business improved overall.
The continuous improvement and Capability Maturity of business is critical. The more data and analysis we can do to gain control over our business, the better. Imagine the industrial facility employing sensors and data collection around its plant. Collecting operational real time data that paired with operations plan specifically tailored to optimize the plant is dynamite. Industry efficiency projections start at 30%. For the plant automating critical processes through Artificial Intelligence, Robotics, Data Collection/Analytics (Real Time and historical) and optimizing people resources efficiency gains add another 20%.
Are you ready for when operating your business is about collecting meaningful performance and attribute data to analyse for controlling and steering the business? Some of the knowledge areas this can include:
|
Management Consulting, Strategic Business Analysis, Strategic Planning, Selecting Automation Products and Vendors, Automation/Control Systems/SCADA, Project Management Project Control/Cost Control |
Business Process Modelling and Optimization, Business Process Automation, Data Engineering, Collection and Analytics, Engineering, Cyber Security Organizational Change Management, Program Management |
Upon the seeing the first steam engine to power a textile factory in the 1700s you would likely understand the potential over human or draught animal power. Would you be able to direct the whole orchestra to implement it?
Revolution implies that it all happened in an instance. Rather these are transitions over time. An invention or an insight here and an industry approach implemented there that in summation became the spinning wheel, the steam engine, light bulb, modern computer, K-clustering algorithm or speech recognition. One upon the other.
1st Industrial Revolution: In this period of 250+ years (beginning in the 1700s) more was created than in the previous 2500 years. It provided the platform that our modern world stands on today. It crossed agriculture, manufacturing, mining, transport, and technology. It promoted the scientific method. It had a profound effect on socioeconomic and cultural conditions. From the invention of the lightening rod and the study of electricity by Benjamin Franklin to automation of textile manufacturing (increased production 50-fold) to the invention of the steam engine, use of coal and water power, steel smelting to fertilizers and new tools along the way to help
It changed everything. Also, known as Industry 1.0.
2nd Industrial Revolution: This is the period of electrification and mass-production (assembly line) as made possible by new technology, the combustion engine and new sources of energy such as electricity, gas and oil. Notable names are Henry Ford, Frederick Winslow Taylor, Thomas Edison, Nikola Tesla, Alan Turing and others. The first data processing machine to decipher Nazi codes was developed and the Programmable Logic controller was invented (Dick Morley). Artificial Intelligence is founded as an academic discipline.
It changed and accelerated everything. Also, known as Industry 2.0.
3rd industrial Revolution: Formed from the 2nd Industrial Revolution, this Digital Revolution, began in the late 1900s. It includes the spread of automation and digitization by way of electronics including computers. The internet arrives and spreads worldwide. The impact rivals the 1st Industrial revolution as multiple technologies, ideas, approaches, businesses and revolution build upon layers of automation and digitization. From streaming video, online commerce, IOT, connectivity, the search engine (Google) and more, all come of age and ubiquity.
It changed everything and should be called the age of ubiquity. Also, known as Industry 3.0.
4th Industrial Revolution: Formed from the 3rd Industrial Revolution, this is the era we are in now. It is evidenced by a blurring of lines across all industries and worldwide. Also, known as Industry 4.0.
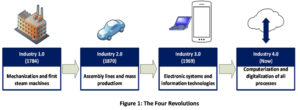
Our tools and the way we work are changing:
Notable Technology impacts include the following (to name a few):
The 4th Revolution brings an unprecedented exponential evolution. Yet the underlying principles remain the same regarding making informed business decisions while the customer is front and center.
There are many impacts purported from Industry 4.0. In the matter of things as they pertain to deriving business decisions, the following are identified.
Data is everywhere. More data will be available tomorrow and yet more the next day. Industry 4.0 is characterized by automation and data sharing as devices connected to the IOT/IIOT produce data at every step of a business process, automation/control lifecycle and every step of product creation, manufacturing, and delivery. With Cloud Computing that data can be stored, processed, and queried from almost anywhere creating potential lakes of data for mining and exploitation including mobile real time from smartphones.
It is as critical as it has ever been for the data to be thoughtful and fit for purpose. Data for data’s sake is seldom useful. In seeking to take advantage of all this data, data engineering/data warehousing for usefulness and applicability to specific business problems is critical.
At least 80% of the effort in taking advantage of Industry 4.0 is in the management, engineering, shaping, and analysis of the data. In the matter of decision making the old rule of Garbage In/Garbage Out is absolute. Data must be fit for purpose to the problem(s) at hand. Meaning you have to identify the problem or question you are asking of the data, ensure the data is appropriate for that question and that all the processes, structure and technology are in place to be successful.
Data comes from a variety of source in Industry 4.0, including:
|
· Sensors (IIOT) · Social · Text · Location |
· Image · Video · Audio · Server/Network Log |
Building and maintaining a data foundation inclusive of cybersecurity is critical. It is critical that companies hire for analytical and mathematical skills and data enablement through data literacy, user friendly technology and enterprise-wide data cultures. Industry 4.0 is 80% reliant on how people work together (including their data and role in the transformed industry) and 20% on technology (John Van Maanen, MIT Sloan School of Business).
People will be elevated out of mundane, repetitive manual tasks into doing the kinds of things humans are good at. Like thinking and creating. Like abstracting processes into better methods and actions.
Especially, supervising machines to ensure that literal interpretation or outliers do not create a crisis such as the as yet undiscovered, one in a million combination of lighting and other factors for the self-driving car to misinterpret parallax and a person for a lamp post and careen through a cross walk full of pedestrians.
If we have learned one thing, it is that all machines are best in service to people and controlled by people. Industry needs SMEs to navigate all of these matters in order to transform a business into Industry 4.0.
An example of the specialized capabilities needed to leverage Industry 4.0 is the presentation of data. We have long learned that “how you present data matters”. It has been said that Minard’s graphic of Napoleon in Russia is “one of the best statistical drawings ever created”.
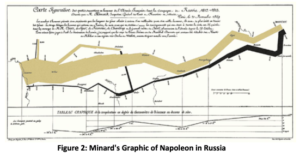
When compared to some more obvious and straight forward representations of the data, we can see what this means. This is not a series of line graphs or charts. It makes data understandable, displaying 6 independent variables at once.
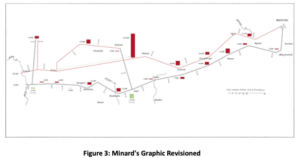
A revisioning of Minard such as in figure 3 reduces the graphic to path to a simple line. Perhaps not as understandable as the original but perhaps a more modern analysis.
Menno-Jan Kraak, formerly of the International Institute for Aerospace Survey and Earth Sciences (ITC) produced the representation of Figure 4.
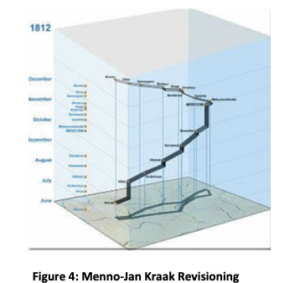
Clearly, representation matters and is an effective tool for telling the story of the data.
Another area of data presentation is in the design of Human Machine Interfaces (HMI) such as you see on Industrial Automation and SCADA systems. Thoughtful design of these screens is required such that critical information and data displayed is easily conveyed to operators.
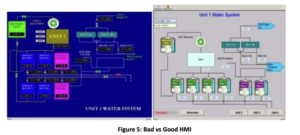
Good HMI design that presents data clearly and concisely so that an operator can determine the next action is critical. The more mission critical the system the more critical is the data presentation. A great deal of industry best practices, standards and approaches have been developed in regards to HMI design. As shown in figure 5, the HMI on the left has poor use of colour and is confusing while the right shows a good HMI.
Honeywell offers 3D representations that can be used to build virtual reality simulators for training, control and plant floor walk arounds. Refer to figure 6.

Reports, presentations, application screens, web sites and HMI screens all present data, and their design and specialized expertise, is critical to relaying information for effective business decisions. As is the teams of individuals skilled in applying these technologies, approaches and best practices to your business.
Data Analytics is the purview of Data Science and confluence of Domain Expertise and Scientific Methods
and Technology as represented in figure 7.
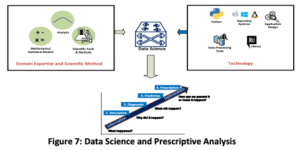
Data Science uses Domain Expertise and the Scientific to collect, explore and visualize data. Mathematical and statistical models are used to find patterns and solutions in data (to business problems).
This Data Analysis can result in the following types of results:
Data Analysis is dependent on expert mathematical and statistical knowledge to leverage technology and domain knowledge to develop correct patterns and interpretations that avoid business difficulties, systemic failures and damage or undesirable results.
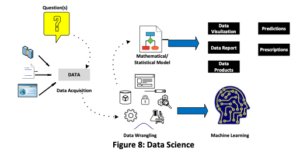
The overall role of data science is as illustrated in figure 8.
Artificial Intelligence is generalized as “the capability for a machine to imitate human behaviour.” This typically is demonstrated in the following three parts:
Artificial Narrow Intelligence represents the bulk of systems implemented today. It is limited to one or two functional areas and specific domains. These systems are not self-aware and do not have cognitive function. While they appear to be making intelligent decisions it is statistics/math.
|
· Smartphone Apps · Image Identification · Self-driving · IBM’s Watson · Machine Learning |
· Chess and AlphaGo · Speech Recognition · Google Translate · Spam Filters · Chatbots |
Artificial General Intelligence cover more than one functional area such as reasoning, problem solving and abstract thinking. These are advanced systems trained to use data to improve themselves. No true systems like this exist but are under development and research.
Artificial Super Intelligence are systems characterizing cognitive self-learning and self-awareness. Faced with an unfamiliar task the system could find a solution. No true systems like this exist.
The state of Artificial Intelligence today can be summarized as follows:
It is expected that AI’s improvement will proceed at an exponential rate leading to more breakthroughs and advancement in the science that propel the industry to Artificial General Intelligence.
AI is a collection of technologies that when brought together enable systems, processes, or machines the provide advance analytical tools promoting analysis moving from the descriptive to the prescriptive while freeing up people from the mundane to more valuable and creative activities. AI’s potential is enormous and applicable to a many industries and applications to optimize performance, accuracy and quality.
According to Gartner, AI will eliminate 80% of today’s manual project management tasks by 2030.
AI-based project management tools target assist project managers by taking on data driven tasks such as automating redundant tasks, enhancing engagement and productivity. This helps project managers process complex project data and uncover patterns that may affect project delivery.
AI will assist, not replace Project Managers by providing better tools. Use Cases for AI in Project Management include:
Forecasts suggest that the IIOT could generate $15 Trillion to the global economy by 2032.
Use Cases for AI in Industrial Automation include:
The discussion of this paper has come full circle in providing perspectives on Industry 4.0. It is critical to identify that while the temptation is to jump to solutioning, selecting technology and implementing, this is almost always a mistake. Technology is best kept as a servant to business. The key challenge is not how to start but where to start.
Some matters of consideration and approach are provided below.
Determining what the end results are that the business needs and thereby a derived technological path of implementation, is required. This is a systematic activity of analysis, discovery, and discussion with stakeholders. It is highly recommended that it begins at the senior leadership level as a strategic assessment and planning exercise.
We recommend the following:
Often the health of an organization is conflated with the financials of an organization. It is to be said that typically a healthy organization reports strong financials. However, it is not entirely certain that this means that it must also be healthy. The approach in this paper suggests that health is a matter for consideration as well as other business requirements. That there is tangible value in the health of an organization that will contribute to the bottom line that has factors outside of financials.
Typically, from a pure financial perspective corporate health is looked at by examining the following:
These are all very important. However, it is suggested that other areas should be included in the pursuit of a healthy organization as suggested by Robert H. Rosen, Ph.D., president of Washington, D.C. – based Healthy Companies, Inc:
These matters and concerns should be included to improve an organization while adopting Industry 4.0.
Industry 4.0 has the implied goal that at the basis of this revolution is to advance decision making to the prescriptive whereby we have evidence and support to identify a course of action. That the tools provided support that end. That this will result in business improvement and release human workers from the repetitive and mundane to be engaged in creative and fulfilling work.
It is about business problem solving and the speed at which one can diagnose what is going to happen. That predictive extrapolation that can provide the prescriptive recommendation. Thereby to prevent by making interventions that keep things up and running without interruption. Minimum waste and minimum amount of time to do things really well. It is all about teams of people working together in very precise ways integrated fully with the very best of technology.
Innovation and evolution are all about disruption. From production systems to governance, the way we analyse, understand and create is changing at an exponential rate. 127 new devices are connected to the internet every second, 3D modelling, and augmented reality combined with data measurement systems can greatly increase efficiency and reduce cost. While also improving design speed and accuracy. This is changing everything, again.
The next paper will discuss what we do best. We, at AGO , understand Industry 4.0 along with consulting, management, engineering and other skills to help you with the business analytic and planning tools required to mature business capability along with Industry 4.0.
Lorem Ipsum has been the industry’s standard dummy text ever since the 1500s, when an unknown printer took specimen book. It has survived not only five centuries,